How it works.
In plain words, with every number traceable to a public source and re-checked on every push.
The short version
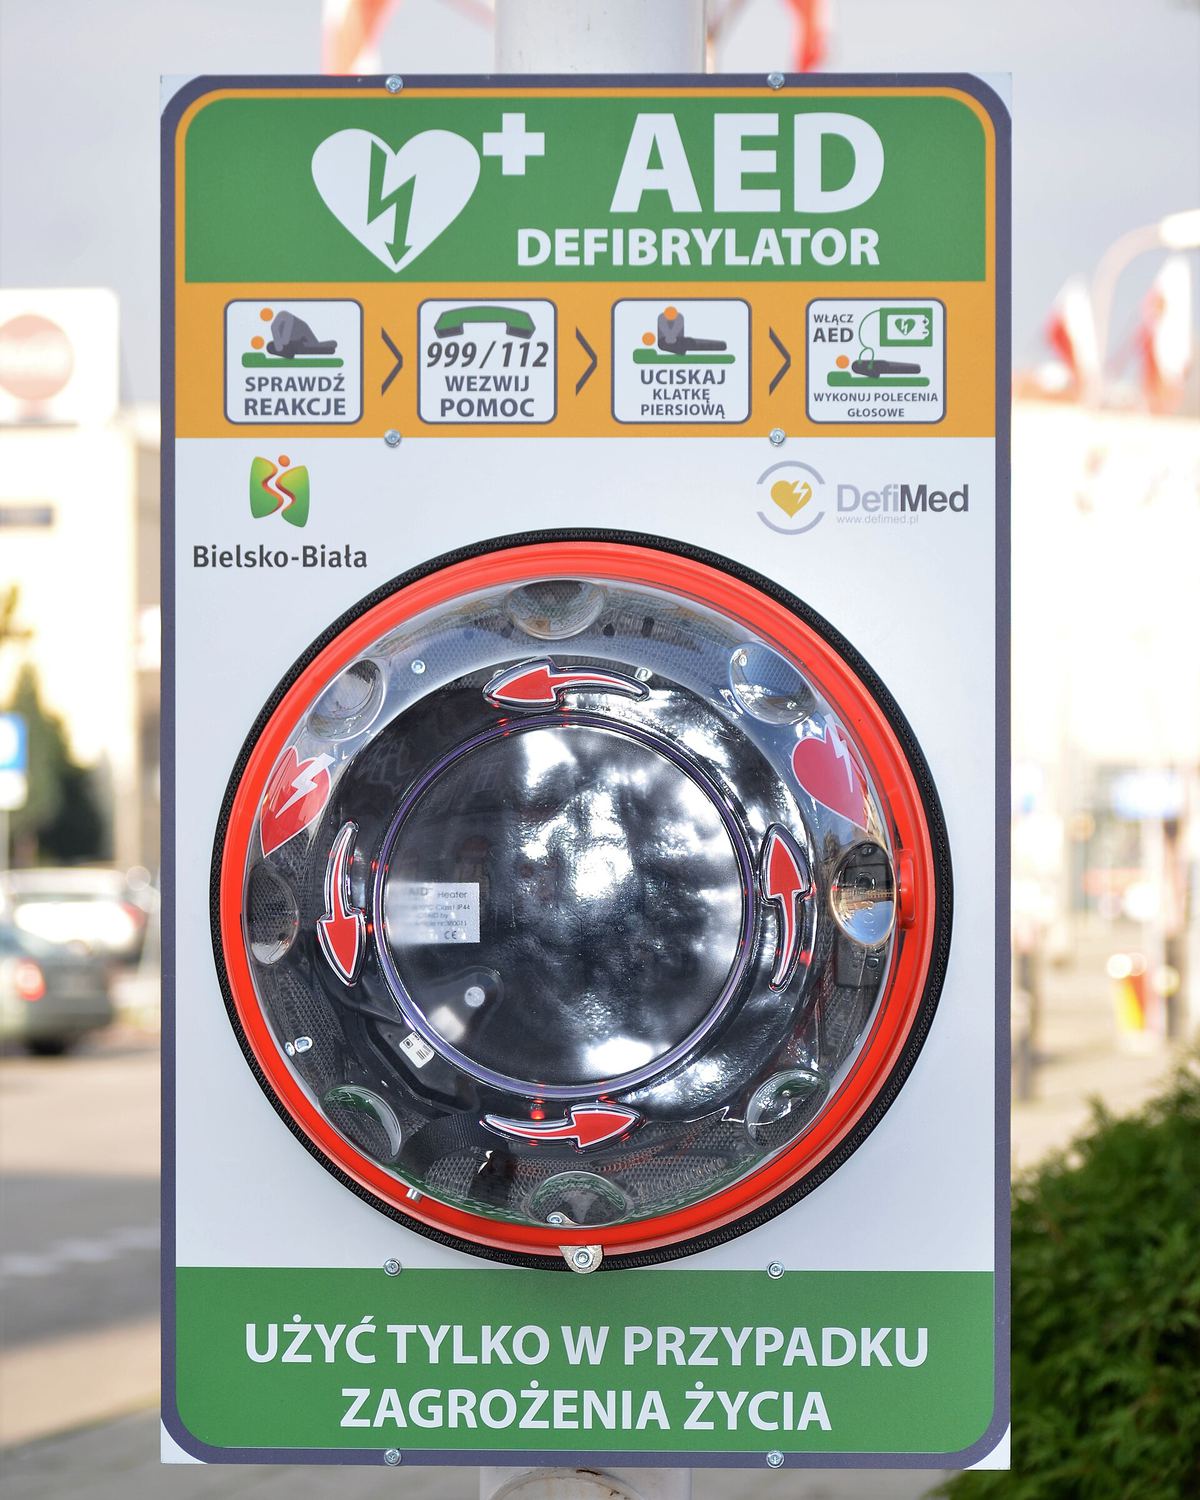
When someone's heart stops, a bystander with an automated external defibrillator (AED) can restart it before the ambulance arrives. Cities publish where their AEDs are. They do not publish when you can actually get to one: most sit inside buildings that lock at night, at weekends and over the summer.
After Hours gives each of New York's 4,032 registered AED locations a weekly timetable, draws the area within a two-minute walk of it on real streets, and replays 25,448 cardiac-arrest 911 calls from 2025 against those timetables. The result: 69% of the coverage a normal AED map shows was behind a locked door at the hour the calls came in.
It then names the AEDs to move first: school defibrillators that, in a weatherproof cabinet on the street wall, would have been within reach of the most of those calls.
The data
| Dataset | What we used |
|---|---|
| NYC AED Inventory NYC Open Data | 7,437 rows, usually one per floor of a building, each with a count of AEDs. Exact repeats dropped (7,357 left), then rows with the same name, address and position merged: 4,032 locations holding 11,008 AEDs. Names, positions, category, floor. No opening hours. |
| FDNY EMS Incident Dispatch Data NYC Open Data | 25,448 dispatches in 2025 whose final call type was cardiac arrest (ARREST), counted by ZIP code, weekday, hour and month. The city publishes only the ZIP code, so we never see an exact location. |
| ZIP code areas (MODZCTA) NYC Open Data | The 177 ZIP areas the calls are counted in, with population estimates. |
| Géo'DAE France, Licence Ouverte 2.0 | 190,776 rows in the national registry, of which 2,253 are working AEDs in Paris. French law makes every owner declare when their AED can be reached, so Paris shows the same pattern from declared hours. It is an independent illustration, not a check on New York's estimate: the two registries are built differently. |
| Overture Maps places Registry of Open Data on AWS | Fire stations, police stations and hospitals near the schools at the top of the list: buildings that are staffed all night and could host a cabinet instead. Amazon Athena reads 2026-10-21.0 in place; of 2,002 candidates we keep 691, dropping clinics, surgeries, doctors' offices, places outside the city and any whose name names another borough. |
Opening hours
Because New York's registry has no hours, we built a timetable for every location and kept a label saying where it came from. The map shows the label on every dot.
| Source | Locations | How |
|---|---|---|
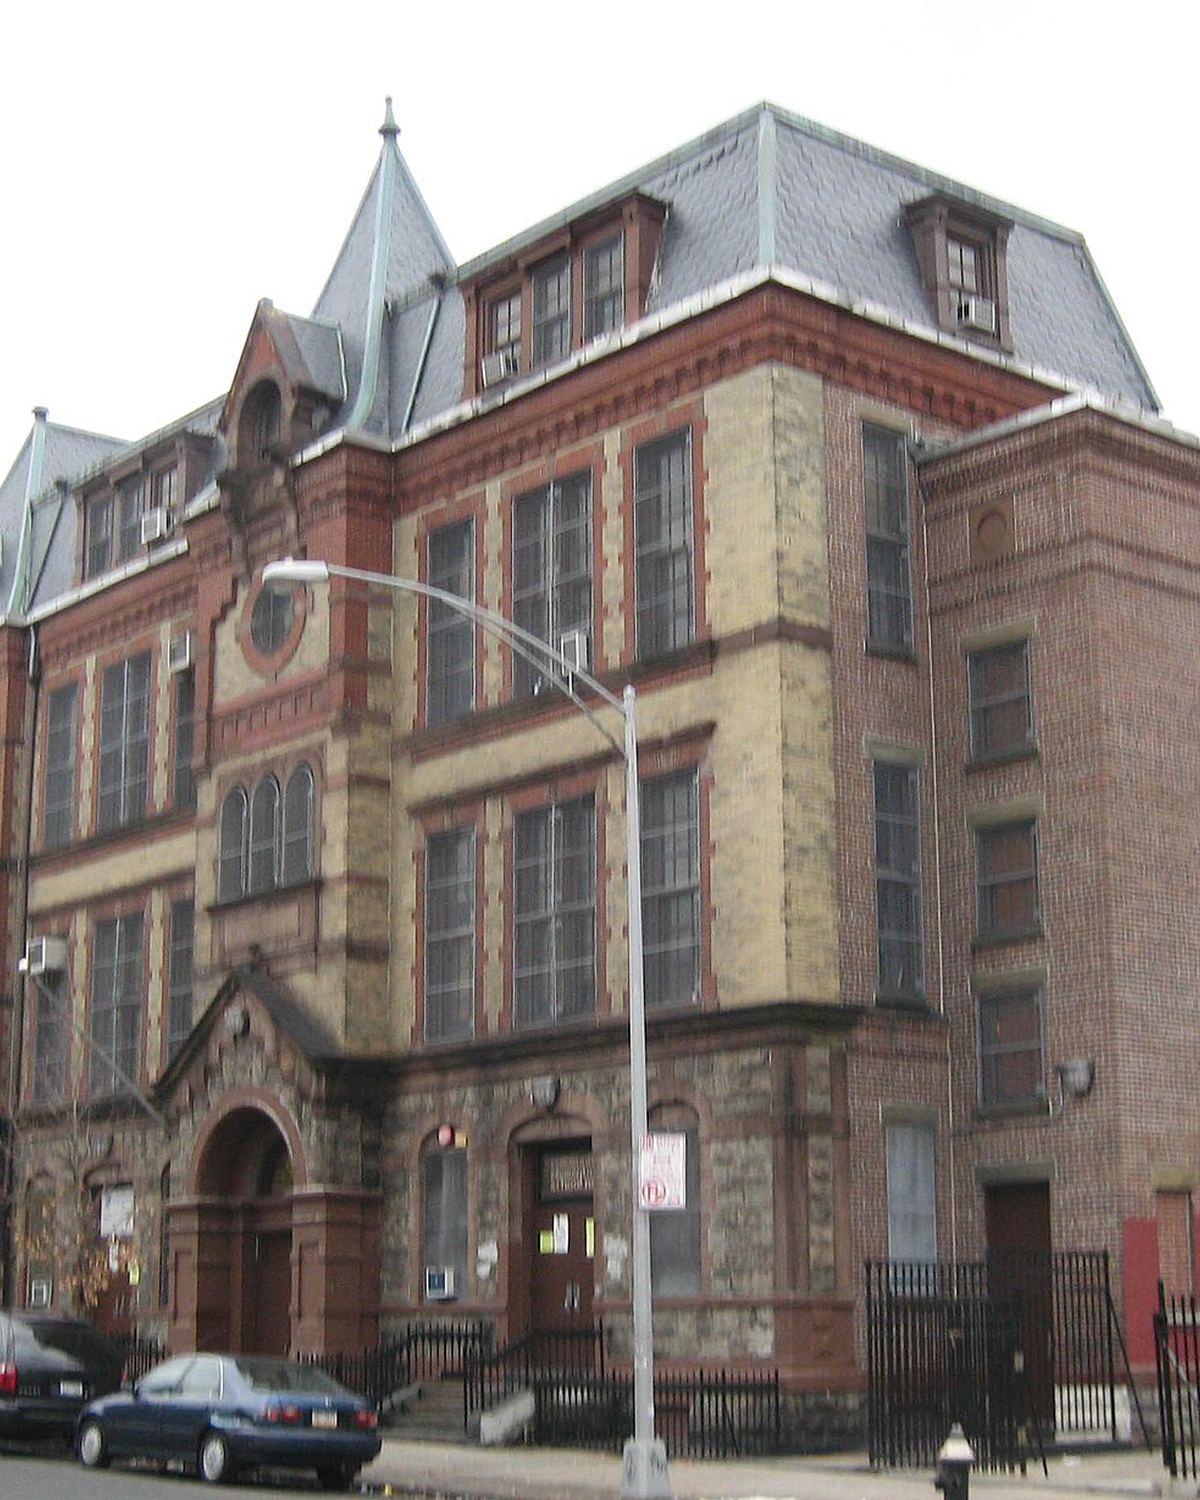
| School calendar | 1,925 | Building open 7 AM to 6 PM on school days, September to June. You can move the closing time to 3 PM or 9 PM on the map. |
| Amazon Location Service | 742 | We searched each venue's name within 200 m of its registered position, kept the match only if the names agreed, and took the opening hours Amazon Location publishes for it. |
| Amazon Bedrock estimate | 1,278 | An estimate from the venue's name, category and floor note. Shown on the map, left out of every headline number unless you switch it on. |
| Unknown | 87 | The model declined to guess. Never counted as open. |
Walking areas
Research on AED coverage usually draws a 100 m circle. A circle walks through buildings and across rivers. Amazon Location Service (Routes, CalculateIsolines, travel mode Pedestrian) drew the area a person can walk in two minutes from each of the 4,032 locations, along real streets.
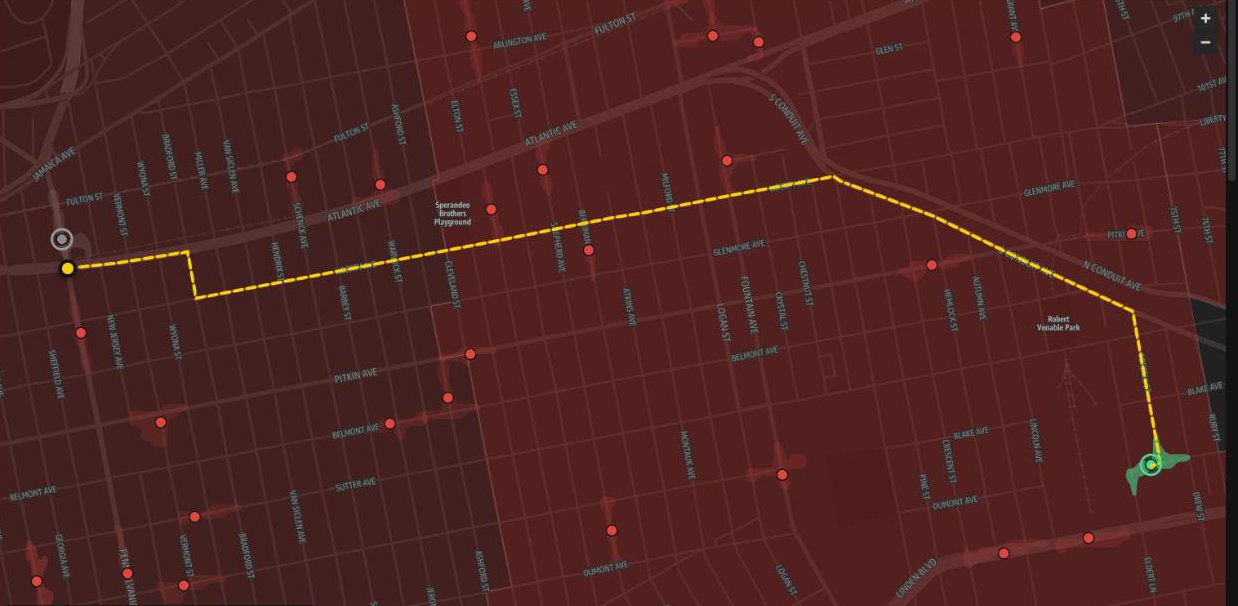
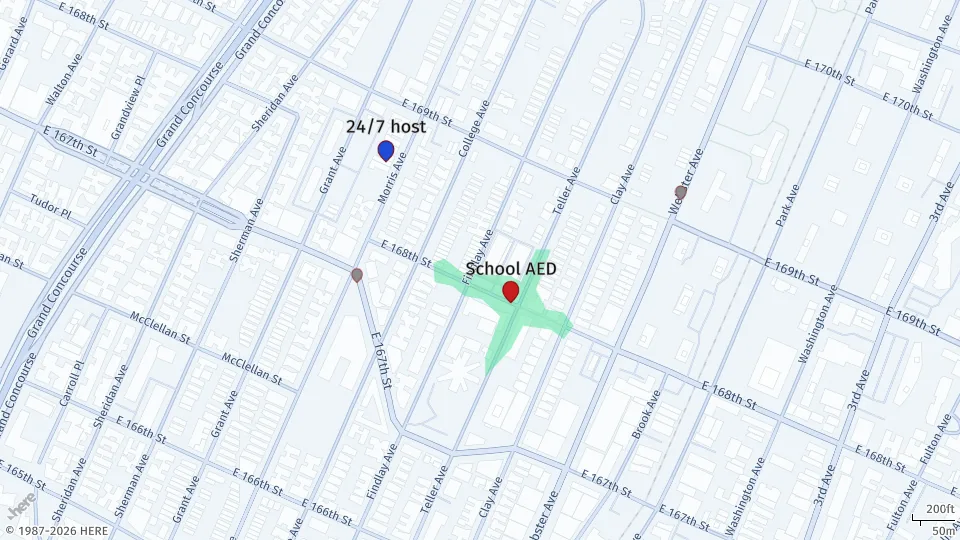
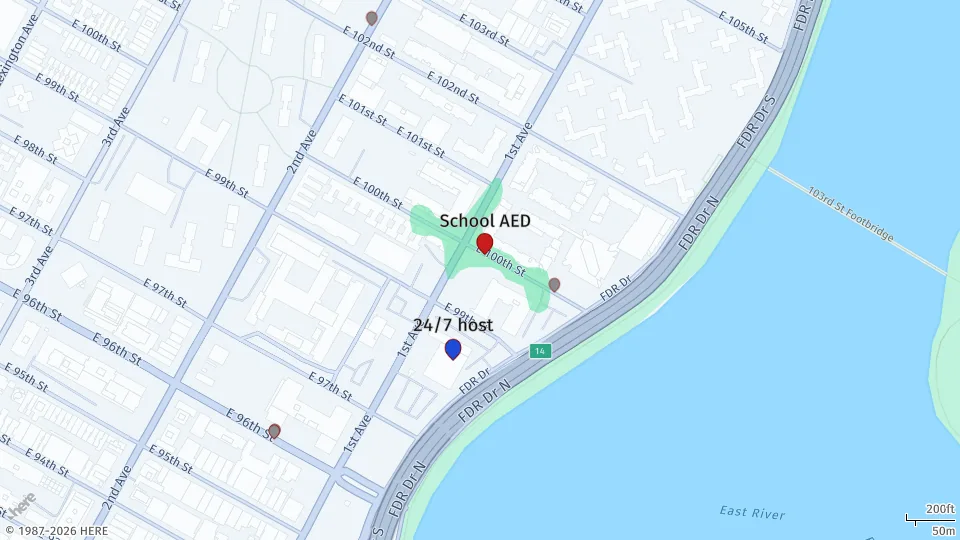
Two minutes there and two minutes back means the first shock comes about four minutes after the collapse, plus the time the AED takes to check the rhythm. Each minute without CPR and defibrillation costs roughly 7 to 10% of the chance of survival.
Coverage
We laid a 50 m grid over the city (303,075 squares) and, for every hour of a school-year week and a summer week, asked of each square: is it inside the walking area of an AED that is open now?
Calls are only published by ZIP code, so each ZIP's calls at a given hour are spread evenly over its squares. That gives two numbers we can compare:
- What a time-blind map shows: 4.6% of call-weighted area is within two minutes of some AED.
- What was open when the calls came: 1.4%. If every venue of unknown hours were open around the clock, it would still be only 1.4% higher.
Both numbers are small, because two minutes on foot is a small area and New York is large. The point is the gap between them: 69% of the coverage disappears once you ask whether the door was open.
Recomputed from the published data by npm run verify on every push.
The ranked list credits each grid square to its nearest school AED and adds up the 2025 calls that fell there while every AED in reach was locked.
Does the ranking beat simpler choices? We scored every way of picking schools with one measure: the expected 2025 cardiac-arrest calls a year inside the walk of at least one chosen school at hours when no AED in reach was open, counting a street square once however many chosen schools reach it. Calls are published by ZIP code, so these are modelled call counts.
| Cabinets at | 10 | 25 | 100 |
|---|---|---|---|
| After Hours ranking | 13.3 | 28.6 | 85.8 |
| Best possible, picked one at a time (greedy) | 13.3 | 29 | 88 |
| Most calls in the walk, ignoring hours | 10.5 | 26.4 | 74.3 |
| ZIP codes with the most calls per AED | 2 | 7.1 | 27.1 |
| Schools picked at random (500 draws) | 2.7 | 6.7 | 26.2 |
Knowing the hours is what earns the gain: a map that ignores them picks schools that are near calls but whose calls mostly come in while the school is open. The ranking comes within 2.5% of a greedy optimiser that re-scores every school after each pick, and it gives each school its own share, which a one-page brief can state. The map shows that sum (84.3 for the top 100) as "at least 84".
Does it hold if the assumptions change? We re-ran the ranking under each alternative and counted how much of the published list survives.
| If… | Top 100 adds, calls a year | Of today's top 25, still in it |
|---|---|---|
| As published (schools lock at 6 PM) | 85.8 (+24%) | 25 |
| Schools lock at 3 PM | 98.9 (+33%) | 22 |
| Schools stay open until 9 PM | 74.6 (+18%) | 21 |
| Every venue of unknown hours open all night | 79.5 (+11%) | 20 |
| Bedrock's estimated hours counted | 84.7 (+16%) | 22 |
P.S. 053 Basheer Quisim stays first in every case. The percentages are against what each case already covers. Full results: ranking-eval.json.
The AI parts
Estimating hours. Before using Amazon Bedrock (Claude Haiku) on venues with no published hours, we tested it blind on 742 venues whose hours Amazon Location Service does publish.
| Left as unknown (no estimate) | 30 of 742 |
| Hours of the week matching the published hours | 85% |
| Estimated open where published hours say shut | 8.3% |
| Estimated shut where published hours say open | 6.9% |
| Estimated "open 24/7" where published hours differ | 17 venues |
Headline numbers use published hours and the school calendar. The AI estimates are shown on the map and are one switch away, so you can see what they add.
Hearing both sides. For any school on the list, two agents argue whether to move its AED outdoors, and a third gives a verdict. They receive eight numbered lines of evidence from the data and must cite them. Sentences that state a number without a citation are counted and shown under every debate.
Reading questions. A question typed into the map is read by Amazon Bedrock into a place, a day or date, an hour, and two flags: is the place inside New York City, and is someone collapsing right now. Its only job is reading. Code turns the day into the hour of the week, Amazon Location Service finds the place, and the map's own engine gives the answer. A landmark only counts if the result carries the name asked for, so every place shown is the place asked for. We test it with the clock fixed at Sunday 1 November 2026, 10 AM.
| Development set | Held-out set, run once | |
|---|---|---|
| Questions read right (place within reach, right day and hour) | 19 of 20 | 12 of 12 |
| Emergencies that showed "call 911" first | 8 of 8 | 3 of 3 |
| Everyday and look-alike questions flagged as emergencies | 0 of 24 | 0 of 15 |
| Places outside the city declined (Jersey City, Yonkers, Hoboken…) | 10 of 10 | 4 of 4 |
| Off-topic or injected text that put nothing on the map | 6 of 6 | 2 of 2 |
Every question with its answer is in evals.json. Rerun it with npm run eval -w api.
Registry watch
Every night Amazon EventBridge Scheduler starts a job that copies New York's AED registry into an Apache Iceberg table on Amazon S3, using Amazon Athena. Iceberg keeps every version, so the job can compare tonight with the last night and publish what changed.
Loading the latest snapshot…
The pipeline
- Open dataNYC Open Data, Géo'DAE, Overture Maps on the Registry of Open Data on AWS
- HoursSchool calendar, Amazon Location Places, Amazon Bedrock
- Walking areasAmazon Location Routes isolines
- Coverage50 m grid × 336 hours, call-weighted
- StoreAmazon S3, Apache Iceberg via Amazon Athena
- ServeAmazon CloudFront, Amazon API Gateway, AWS Lambda, MCP
To reuse it for another city: export your AED list with an opening_hours column, drop it on the Your data page or send it to POST /api/v1/analyze. To run the whole thing yourself: npm run pipeline, then cdk deploy.
Scope and assumptions
- Calls by ZIP code. FDNY publishes calls by ZIP code, so each ZIP's calls are spread evenly over its streets, and the ranking points to where a site visit is worth it.
- Homes included. Most cardiac arrests happen at home, and the calls include them; a street-wall AED a short walk away serves the homes around it.
- The dispatcher's settled call type. We count calls whose final type is cardiac arrest (25,448 in 2025).
- Hours from published sources. Headline numbers use published hours and the school calendar. 1,278 locations have AI-estimated hours and 87 have none; counting every one as open around the clock, 39% of coverage is locked.
- School hours follow the school day, 7 AM to 6 PM. The map lets you set the closing time at 3, 6 or 9 PM; at 9 PM, 65% of coverage is locked.
- Where the AED sits inside. Hours describe the building; each location's card lists where its AEDs are, and a site visit confirms access.
- Registered AEDs. 7,437 registry rows describe 4,032 locations; the map shows every registered one.
Research
- Sun CLF, Demirtas D, Brooks SC, Morrison LJ, Chan TCY. Overcoming spatial and temporal barriers to public access defibrillators via optimization. J Am Coll Cardiol 2016;68(8):836–845. In Toronto, 1 in 5 cardiac arrests near an AED happened while it was locked. Paper
- Hansen CM, Wissenberg M, Weeke P, et al. Automated external defibrillators inaccessible to more than half of nearby cardiac arrests in public locations during evening, nighttime, and weekends. Circulation 2013;128(20):2224–2231. In Copenhagen, coverage fell 53% outside office hours.
- Pollack RA, Brown SP, Rea T, et al. Impact of bystander automated external defibrillator use on survival and functional outcomes in shockable observed public cardiac arrests. Circulation 2018;137(20):2104–2113. Survival to discharge 66.5% with a bystander shock, 43.0% without. Paper
- Larsen MP, Eisenberg MS, Cummins RO, Hallstrom AP. Predicting survival from out-of-hospital cardiac arrest: a graphic model. Ann Emerg Med 1993;22(11):1652–1658. Survival falls about 7 to 10% for each minute without CPR and defibrillation.
Check it yourself
Every number on this site is computed by the pipeline in the public repository and written to the files below. npm run verify recounts the headline numbers from these CSVs with the same engine and asks the live API the questions the article quotes; it runs with the tests on every push. One example to try by hand: in relocation.csv, the top 100 rows add up to 84.3 calls a year, and P.S. 053 Basheer Quisim is first with 1.65.
- NYC AED locations with hours and their sourceCSV, 4,032 rows
- Coverage by ZIP code at four moments of the weekCSV, 177 rows
- The 100 schools to make 24/7, rankedCSV
- Paris AEDs with declared hoursCSV, 2,253 rows
- Every number on this siteJSON
- The ranking against four other ways of choosing, and under five assumptionsJSON
- "Ask the map" tested on 72 questions, every answerJSON
- Template for your own listCSV